
Solscan Dashboard: Fee Tracker
Table of Contents
- Accessing the Dashboard
- Overview
- Current Block Info
- Last Blocks Info Chart
- Priority Fee Tracker - Network Fee
- Daily Block Fees
- Daily Non-Vote Fees and Jito Tips
- Daily Priority Fees vs Jito Tips Share - Program Resources
- Top Programs by Fees Consumed in the Current Block
- Top Programs by Fees Consumed per Transaction in the Current Block
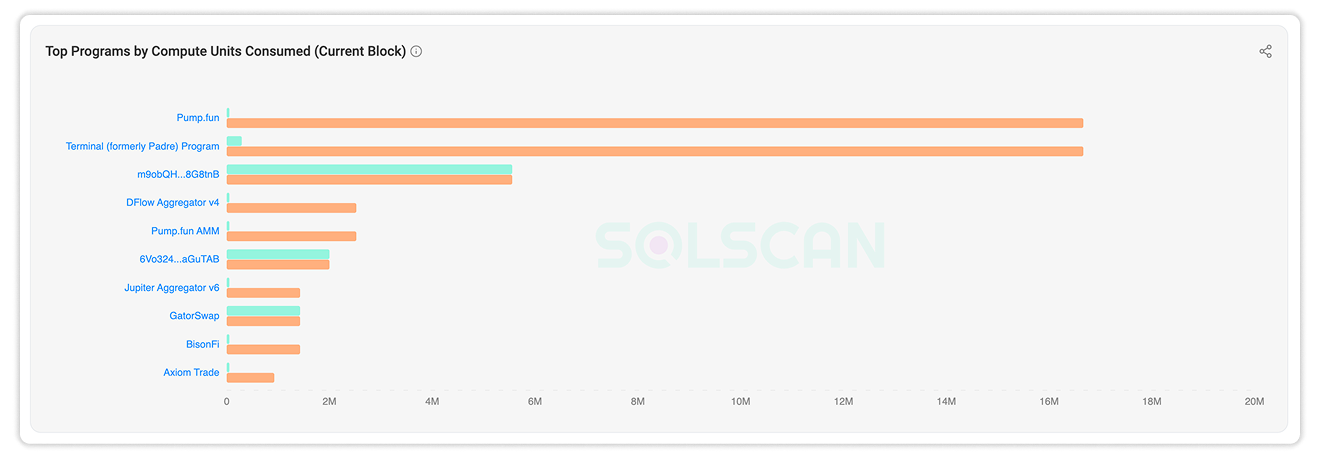
- Top Programs by Compute Units Consumed in the Current Block
- Top Programs by Fees Consumed Over the Last 24 Hours - Top Spenders
- Top Fee Spenders (Last 24H)
Transaction costs on Solana extend beyond the base fee attached to each transaction. Priority fees, compute-unit prices, vote fees, and Jito tips also affect how users and applications compete for blockspace.
The Solscan Fee Tracker combines current block data with historical network fee statistics, program resource consumption, and fee-payer activity. Together, these datasets show how fees change over time, which programs consume network resources, and which accounts contribute the most to recent fee activity.
Accessing the Dashboard
Bookmark the link at Solscan Fee Tracker, or open the dashboard directly from the Analytics dropdown on Solscan homepage, select Analysis > Fee Tracker Dashboard.
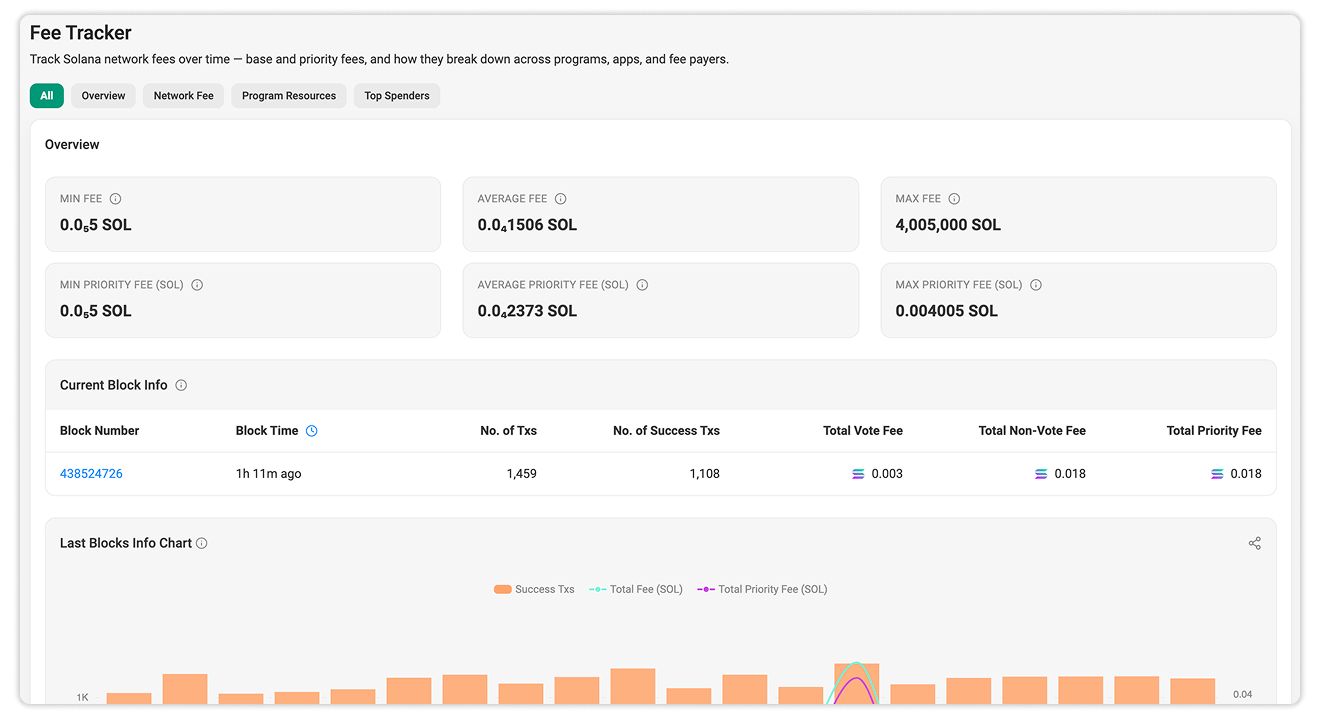
At the top of the page, you’ll find five tabs: All, Overview, Network Fee, Program Resources, and Top Spenders. Select a specific tab to examine one area, or select All to view every section on a single page.
Charts and tables include controls for viewing additional results, opening related blocks, programs, and accounts on Solscan, and sharing selected charts.
Overview
The Overview section provides a current view of transaction fees and recent block activity on Solana.
Its summary metrics include:
- Minimum fee: The lowest total transaction fee (base + priority).
- Average fee: The average total transaction fee paid per transaction.
- Maximum fee: The highest transaction fee paid for a single transaction.
- Minimum priority fee: The lowest priority fee (tip added on top of the base fee) recorded.
- Average priority fee: The average priority fee paid per transaction.
- Maximum priority fee: The highest priority fee paid for a single transaction.
Together, these metrics show the current range of transaction fees and the amount attributable to priority fees.

Current Block Info
The Current Block Info table displays a fee breakdown of the latest block.
It includes:

Vote fees are generated by validator voting transactions. Non-vote fees cover other transaction activity, including transactions submitted by users, applications, and trading systems.
The block number links to its corresponding block page, allowing users to move from the network-level overview to the transactions and instructions recorded within that block.
Last Blocks Info Chart
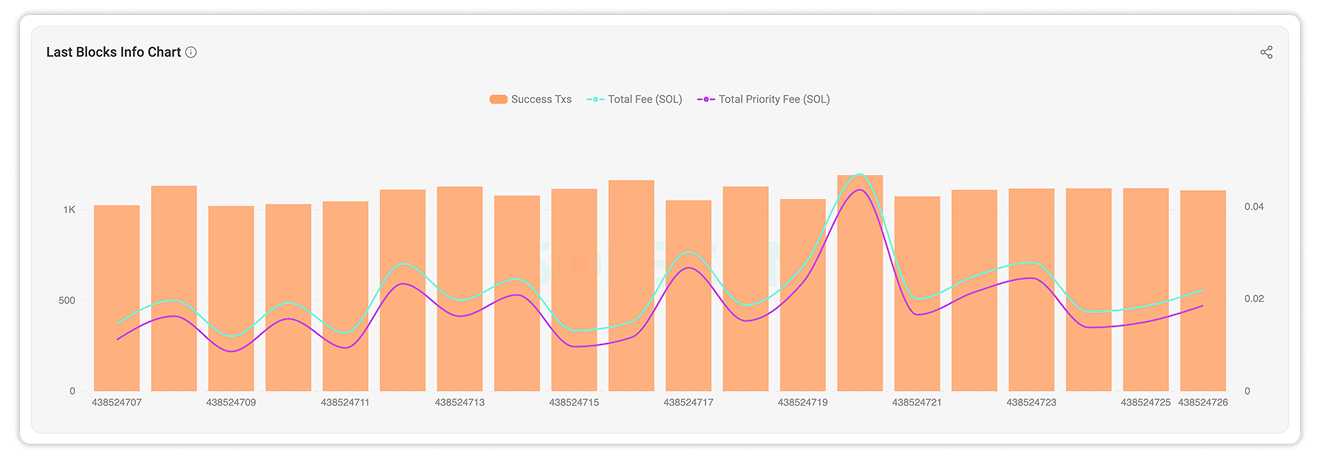
The Last Blocks Info Chart compares three values across recent blocks: Successful Transactions (bar), Total Fee, and Total Priority Fee.
Successful transaction counts represent block activity, while the fee lines show how transaction costs changed across the same blocks. Viewed together, these values help distinguish fee increases associated with higher transaction activity from increases driven by priority-fee bidding.
Priority Fee Tracker
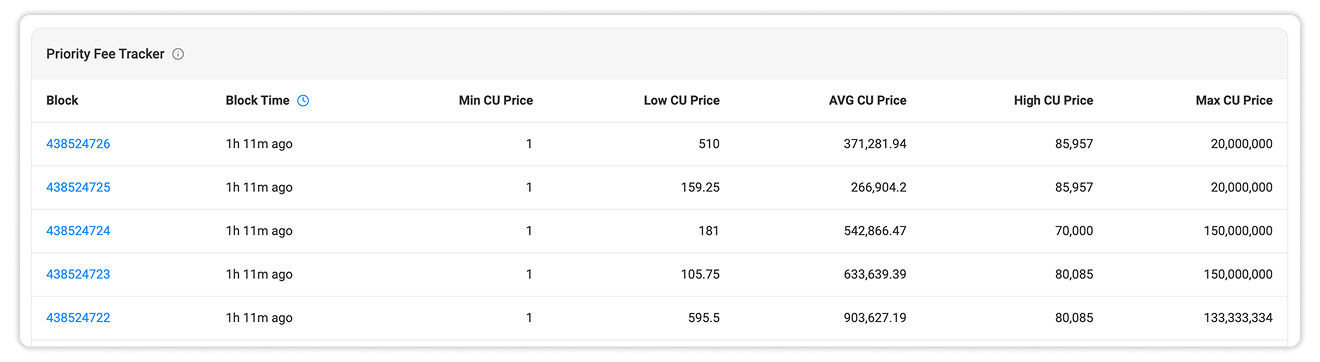
Priority fees allow transaction senders to assign an additional fee based on the compute units requested by a transaction.
The Priority Fee Tracker displays compute-unit price paid to prioritized transactions for recent blocks:
- Minimum CU price: The lowest compute-unit price recorded in the block.
- Low CU price: A lower-range reference value for compute-unit prices in the block.
- Average CU price: The average compute-unit price recorded in the block.
- High CU price: An upper-range reference value for compute-unit prices in the block.
- Maximum CU price: The highest compute-unit price recorded in the block.
Each row includes the corresponding block number and block time. These values show the range of compute-unit prices used within each block and make it easier to identify blocks containing unusually high priority-fee bids.
Network Fee
The Network Fee section provides historical data on block fees, non-vote fees, and Jito tips.
Daily Block Fees
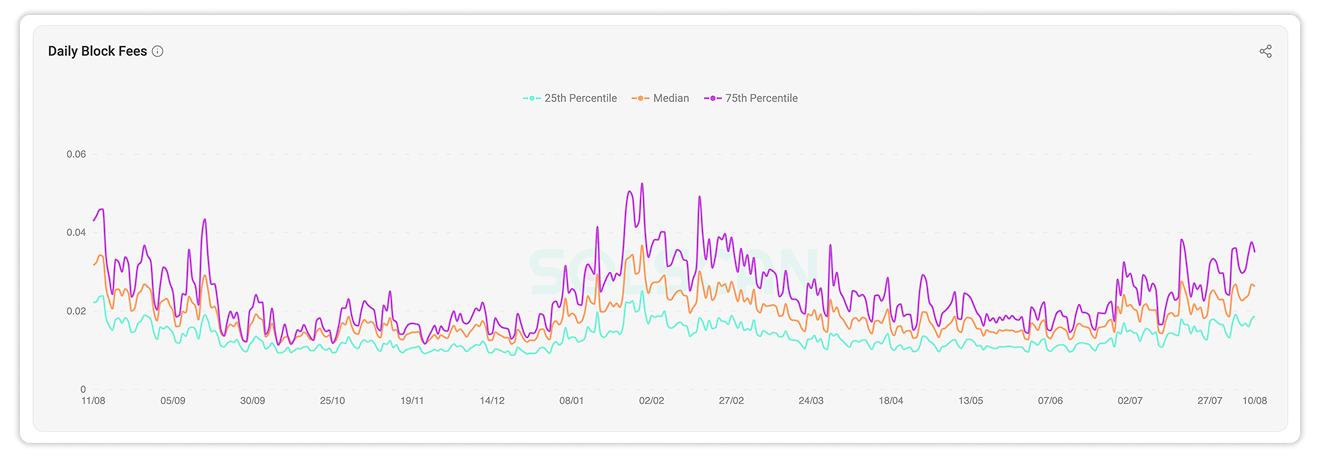
The Daily Block Fees chart tracks three percentiles across blocks for each day:
- 25th percentile (P25): 25% of blocks have fees at or below this value, representing the lower-fee range.
- Median (P50): 50% of blocks have fees at or below this value, representing the typical fee level.
- 75th percentile (P75): 75% of blocks have fees at or below this value, representing the higher-fee range.
The distance between P75 and P25 shows how widely block fees vary. A wider gap indicates a less consistent fee distribution, while a narrower gap indicates more stable fee levels. When all three lines move in the same direction, the change is occurring across the broader fee distribution rather than only among a few blocks.
Daily Non-Vote Fees and Jito Tips
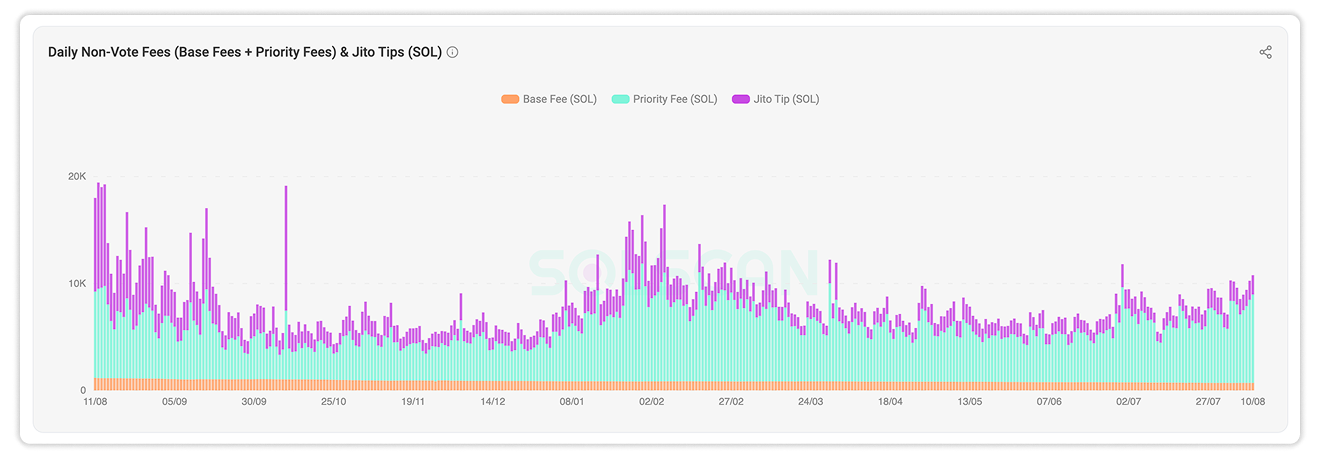
The Daily Non-Vote Fees and Jito Tips chart separates non-vote transaction costs into:
- Base fees: Standard fees required for transactions to be processed on Solana.
- Priority fees: Additional fees paid based on requested compute units to improve processing priority.
- Jito tips: Payments attached to transaction bundles submitted through Jito infrastructure.
This breakdown shows how each component contributes to non-vote transaction costs and how that composition changes over time.
Daily Priority Fees vs Jito Tips Share
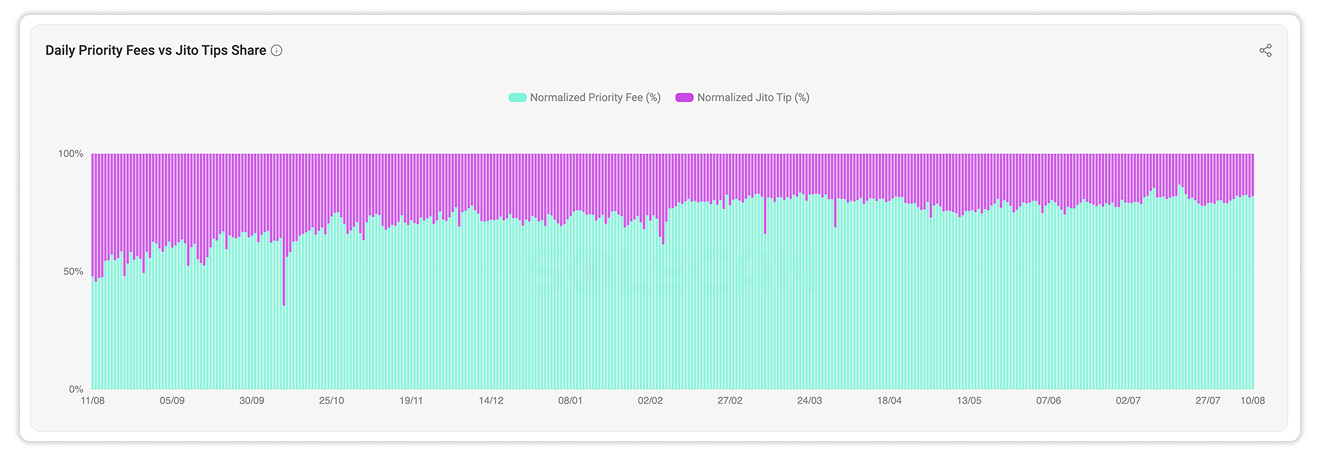
The Daily Priority Fees vs. Jito Tips Share chart compares:
- Normalized priority fee: Priority fees expressed as a percentage of combined priority fees and Jito tips.
- Normalized Jito tip: Jito tips expressed as a percentage of the same combined total.
Each daily value totals 100% across the two categories. This removes changes in absolute fee volume and shows how the relative balance between priority fees and Jito tips has shifted over time.
Program Resources
The Program Resources section shows which programs consume the most fees and compute capacity.
Top Programs by Fees Consumed in the Current Block
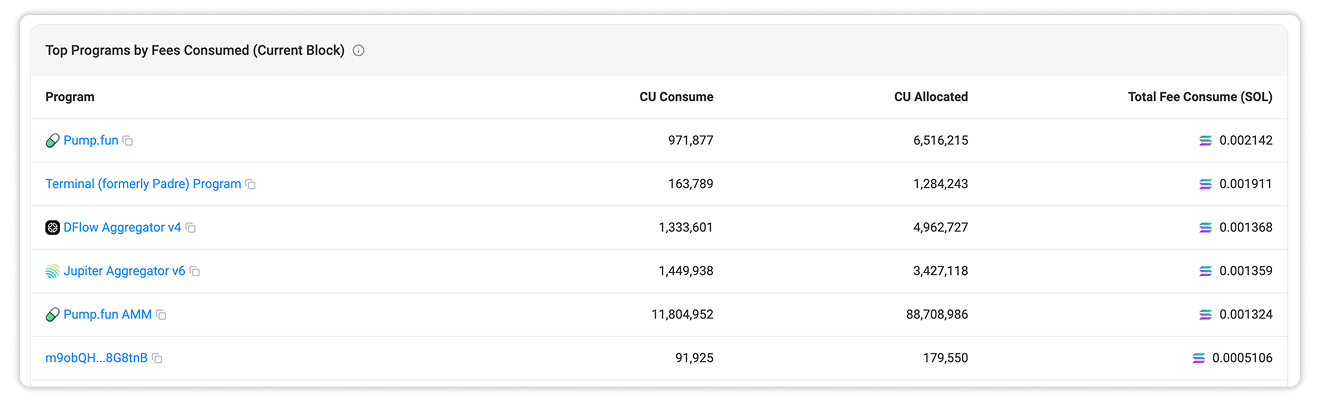
This table ranks programs according to their total fee consumption in the current block.
For each program, it displays:
- Program address or label
- Compute units consumed: The processing capacity actually used by transactions interacting with the program.
- Compute units allocated: The processing capacity requested for those transactions.
- Total fees consumed: The combined fees associated with the program’s activity, displayed in SOL.
Comparing allocated and consumed compute units provides context on both the resources requested by a program’s transactions and their actual compute usage.
Top Programs by Fees Consumed per Transaction in the Current Block
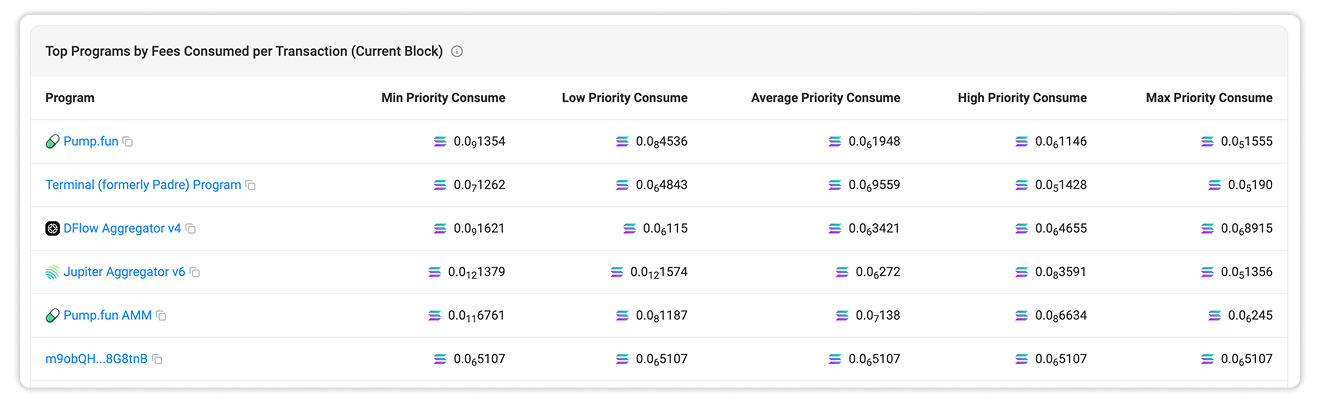
This table compares the priority fees consumed per transaction by leading programs in the current block.
For each program, it displays:
- Minimum priority consumed: The lowest priority fee paid by a transaction interacting with the program.
- Low priority consumed: A lower-range reference value for priority fees paid per transaction.
- Average priority consumed: The mean priority fee paid per transaction.
- High priority consumed: An upper-range reference value for priority fees paid per transaction.
- Maximum priority consumed: The highest priority fee paid by a transaction interacting with the program.
These values show how priority-fee spending varies across transactions associated with each program. Comparing the full range helps distinguish programs with consistently high priority fees from those whose averages are affected by a smaller number of unusually expensive transactions.
Top Programs by Compute Units Consumed in the Current Block
The chart compares two values among the leading programs in the current block: Minimum CU Price (green bar) vs Maximum CU Price (orange bar).
This view makes it easier to identify the programs responsible for the largest share of current compute demand and compare their requested capacity with the amount consumed.
Top Programs by Fees Consumed Over the Last 24 Hours
This table ranks the top 100 programs by fee consumption and compares their activity across three-hour and 24-hour periods.
For each program, it displays:
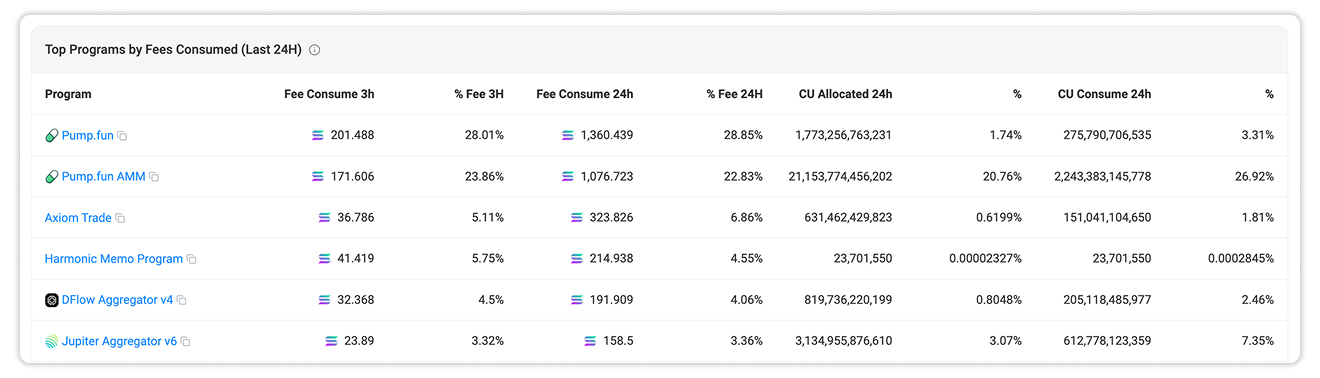
The percentage columns measure each program against the corresponding total for the top 100 programs shown in the dataset. They do not represent the program’s share of all network-wide fees or compute-unit activity.
Comparing the three-hour and 24-hour periods helps distinguish recent increases in activity from programs that consistently account for a large share of fees and compute usage among the leading programs.
Top Spenders
Top Fee Spenders (Last 24H)
The Top Spenders section ranks the top 200 accounts by transaction fees paid during recent three-hour and 24-hour periods.
For each account, the table displays:
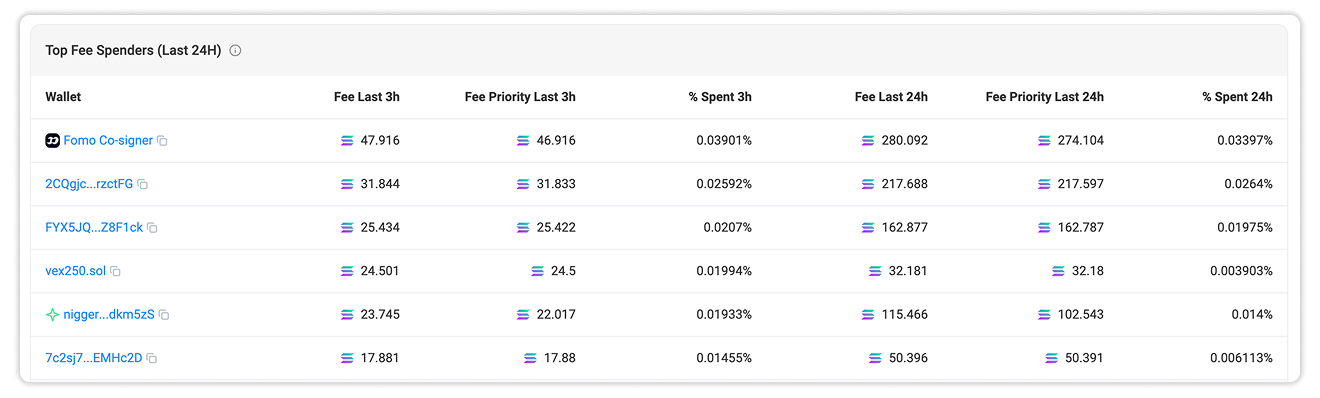
The percentage columns compare each account with the corresponding total for the top 200 fee spenders in the dataset. They do not represent the account’s share of all fees paid across the Solana network.
Comparing total fees with priority fees shows how much of an account’s transaction cost came from priority bidding. The three-hour and 24-hour periods also help distinguish recent spending spikes from sustained fee activity among the leading fee payers.

Still Have Questions?
Supported Explorers
 Solscan
  Eclipsescan
  Fogoscan